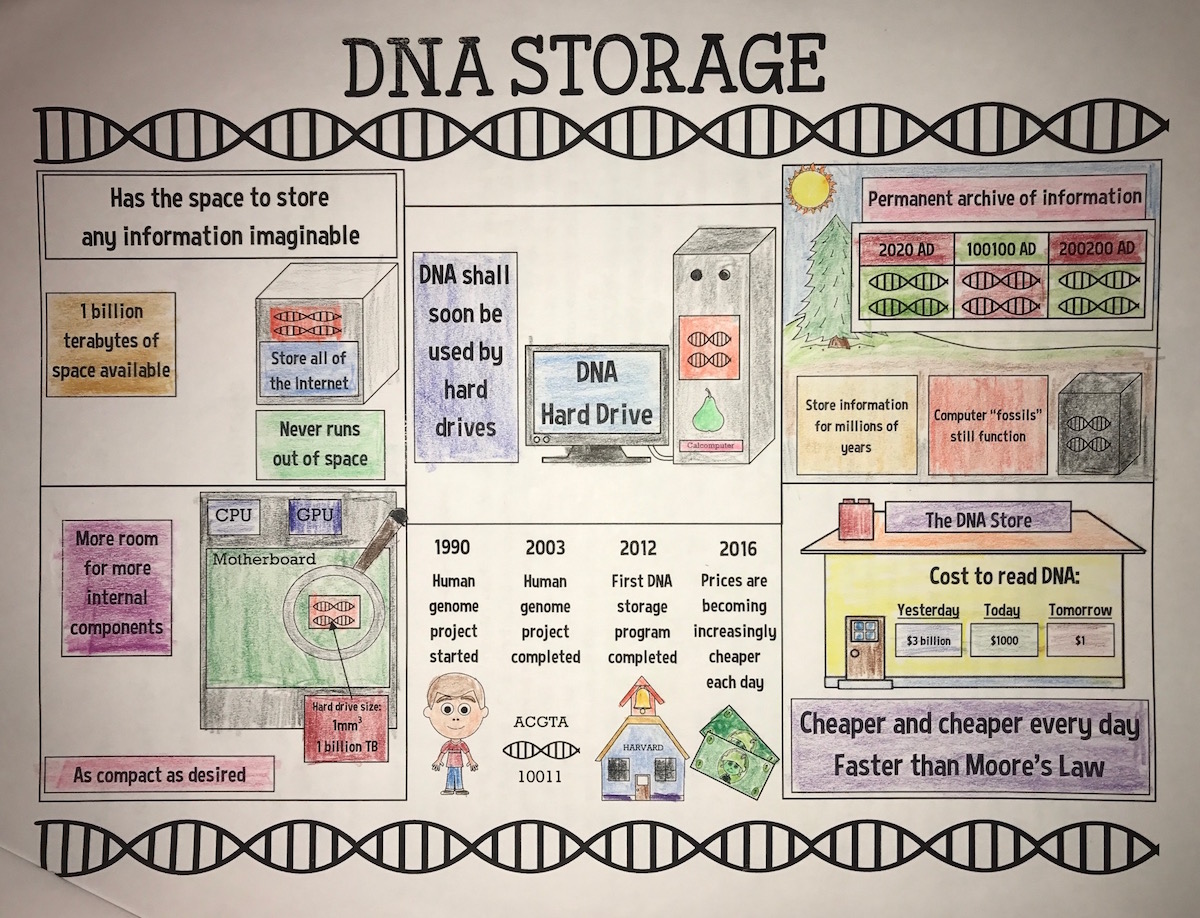
Our son was given an interesting assignment in his chemistry class this week. The teacher asked the students in his class to come up with an interesting scientific question. Our son, who took a course on DNA at Duke Tip, has become interested in DNA and genetics, so he chose to explore whether or not using DNA as a means of storing information is a viable option, or if it will become a viable option as costs for such technology come down in the future.
The interesting part of this chemistry assignment was that the teacher tasked the students with creating an infographic, an interesting way of representing information or data in a visual manner. Infographics are engaging and, when done correctly, are much easier and more fun to read and understand than would be a block of text containing the same information.
So our son created his infographic how he chose, placing what he felt was the most pertinent information in an interesting visual manner theinspectorscompany.com. While he created it on the computer, he colored it in himself, which I thought was a nice touch. Here is his completed infographic:
I was quite impressed by this assignment, not only because infographics are interesting and very relevant to the way people present important information on the Internet today, but also because by having students create their own infographics, our son’s chemistry teacher was teaching them a new way to organize and display information and data check out condos for sale downtown san diego. This is a useful skill, as many jobs require presentation and communication skills, and skills with software tools such as Microsoft PowerPoint, Visio, and Publisher. I think that learning the skill of presenting information in a way other than in standard essay format is very useful.


